
Analyze your portfolio on real historical data
Build any mix of stocks and indices and see what it actually returned, how much risk it took, and what was left after rebalancing and capital gains tax. Year by year, holding by holding.
French markets free forever. Every global market $3/month after the trial. Cancel anytime.
What the portfolio analyzer shows you
Returns you can trust
Cumulative and annualized return for the whole portfolio and for every holding, calculated from real historical prices. Nothing estimated or simulated from averages.
Risk next to return
Monthly volatility, monthly Sharpe ratio and the lowest annual return sit beside performance, so you see what each return cost you in risk.
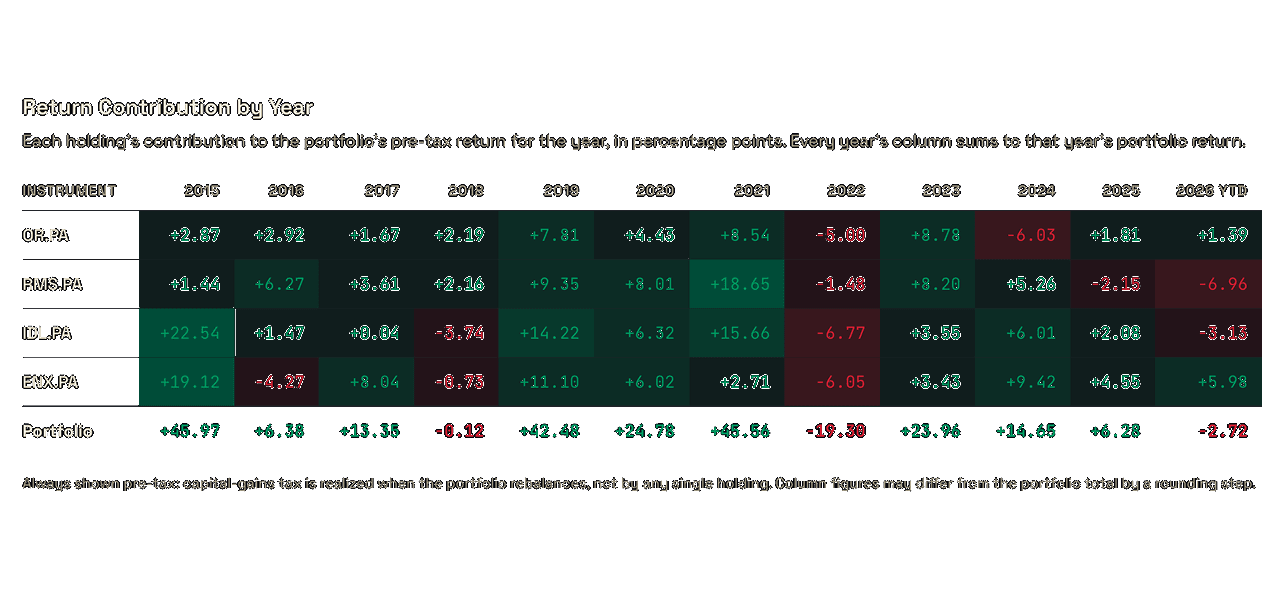
Return contribution by year
See which holding drove the portfolio up or dragged it down in every calendar year, instead of one blended number.
Rebalancing, modeled
Run the same mix with no rebalancing, once a month or once a year, and compare how the drift changes your result.
After-tax returns
Switch between pre-tax and after-tax results. Set a capital gains tax rate, start from a country preset, and carry losses forward like a real account would.
Save it, export it
Save portfolios to come back to them, and export a PDF report of the full analysis to share or keep.
How to backtest a portfolio in three steps
- Step 1
Build the mix
Search stocks and indices across 40+ global markets and add up to 50 instruments with your own allocations.
- Step 2
Set the rules
Choose the simulation period, how often to rebalance, and whether to look at returns before or after capital gains tax.
- Step 3
Read the result
Get the portfolio's return, volatility, Sharpe ratio and worst year, plus each holding's contribution, year by year.
Every global market for $3/month
Analyze portfolios with US, UK, European and Asian stocks and indices. Start with a 7-day free trial.
- 40+ global indices and every global stock
- Up to 50 holdings per portfolio
- Rebalancing and after-tax returns
- Saved portfolios and PDF reports
Portfolio analyzer FAQ
What does a portfolio analyzer do?
It takes a mix of investments and their weights and shows how that portfolio would have performed over a past period: total and annualized return, how volatile it was, its risk-adjusted return (Sharpe ratio), its worst year, and which holdings drove the result.
Is the WMP portfolio analyzer free?
You can build and analyze portfolios of French stocks and the CAC 40 for free, with no account and no card. Every other global market is part of Premium, which starts with a 7-day free trial.
What data does the analysis use?
Real historical end-of-day prices for each stock and index, from the first date the data is reliable. Returns are calculated from those prices, not estimated from long-run averages.
Can I backtest a rebalancing strategy?
Yes. You can run the same portfolio with no rebalancing, monthly rebalancing or yearly rebalancing over the period you choose, and compare the results.
Does it account for taxes?
Yes. You can switch to after-tax returns, set your capital gains tax rate or start from a country preset, and carry realized losses forward against later gains.
How many holdings can a portfolio have?
Up to 50 instruments, mixing individual stocks and indices.
Is this investment advice?
No. The analyzer shows how a portfolio performed in the past so you can understand its return and risk. Past performance is not a guide to future returns.